Ethical Development of a Transportation Demand Model
Analysis and Modeling

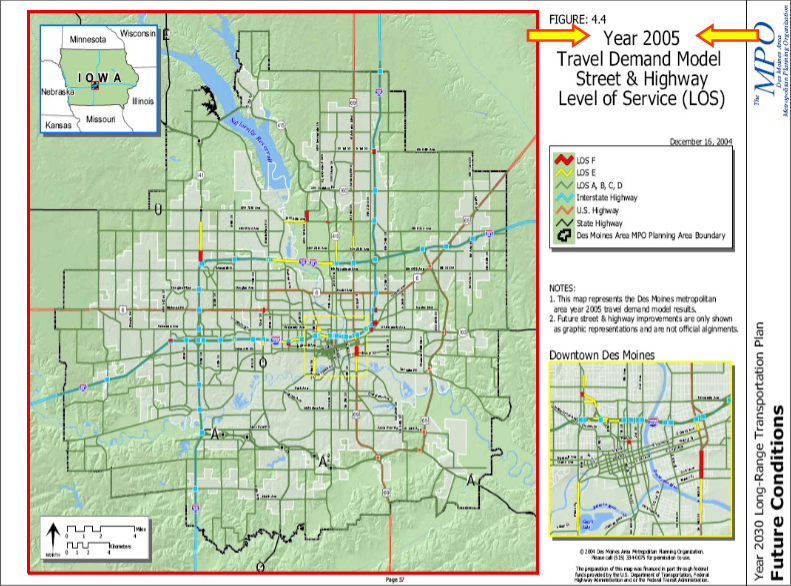
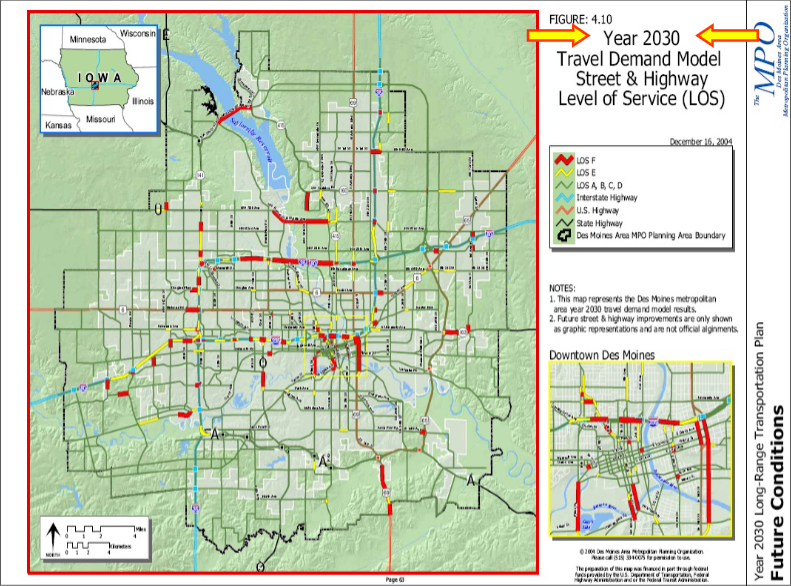
With our database of trips, we can now begin the analysis and modeling phase. The end goal of this part of the project is to have a travel demand model which can accurately predict how various kinds of infrastructure changes will effect the demand for various travel modes over time. In the following example, the Des Moines Metropolitan Planning Organization (MPO) used a travel demand model to show the difference in projected level of service (basically a measure of throughput + density) of the street/highway network in 2005, 2010 (not included), 2020 (not included), and 2030.


Model Description
Partially because this is a philosophy class and not an urban planning class, and partially because I have no idea how to actually create a TDM, I will not be discussing at all how the model will be constructed. Therefore, for the rest of this project the model will be treated as some kind of black box that takes in specific inputs and spits out specific outputs.
However, just because our model is a black box does not mean that nothing can be said about it. The inputs and outputs to the model can be found in the following tables:
Model Inputs
- Transportation Network: Including but not limited to the street/highway/sidewalk/bike networks and the public transit lines.
- Socioeconomic Variables: Used to modify the predicted travel behavior of specific CGBs. For example, an area with a lower value of the variable <cars_per_household> would be less likely to make trips by personal vehicle for obvious reasons.
- Demographic Variables: Used to modify the predicted travel behavior of specific CGBs. For example, an area with a higher value of the variable <population_density> would be less likely to make trips by personal vehicle due to the increased difficulty of parking.
- Built/Natural Environment Variables: Used to modify the predicted travel behavior of specific CGBs. For example, the an area with a higher value of the variable <streetlight_coverage> would be more likely to make trips by walking due to the perceived extra safety of good lighting.
Model Outputs
- The transportation network with both level of service decimal values and level of service category values for each street/highway/sidewalk/bike network segment.
- The category values should be color coded such that a color gradient map can be created of the transportation network
In order to generate before/after maps or make future predictions, the various model inputs should be adjusted accordingly. When trying to generate before/after maps, to get the after map the input transportation network should be modified to reflect the proposed infrastructure change. To get future predictions for a transportation network, socioeconomic/demographic/built+natural environment variables should all be adjusted to projected or ideal values for the given year.
Ethical Concerns
Again, since we are focusing on a travel demand model for non-car transportation, we really want to make sure to accurately capture the travel behavior of all the different kinds of non-car transportation. Because we lack large amounts of data, there is the worry that in our model training procedure, non-car transportation data will be "drowned-out", so to speak.

To show this, let's take a hypothetical example. Assume you are creating a model that aims to classify pictures of the Iris flower into the different kinds of Iris. As can be seen on the left, the many varieties of the Iris flower can take many different forms.
However, unknown to you the Iris dataset has been pruned such that 95% of the flower images are Iris Versicolor. If you train your model on this modified dataset with the goal of 90% accuracy, it is likely that your model will simply learn to always output Iris Versicolor.
Bringing it back to the TDM, because we (relatively speaking) have very little non-car transportation data, it would be possible for the TDM to only predict car transportation trip changes and simply ignore non-car transportation trip changes.
What can be done about this? Well the easiest solution in my mind is one I should have done anyways. the different transportation modes should be split up such that we actually end up with 3-4 different sub-models in our overall model. One model could focus on predicting how car transportation changes, another could focus on transit changes, another could focus on non-motorized transportation, and yet another could focus on motorized micro-mobility. And one final model would tie them all together.
In this way, we can ensure that the travel patterns of all modes of transportation are accurately captured and reflected in our final model.

Another ethical concern is tangential to the first, and potentially more dangerous. Specifically, it is possible that the data of disadvantaged groups, such as children and the elderly are "drowned out". I would say this is especially dangerous because these groups of people are effected in different ways with infrastructure changes. See the following tables for some examples. Note that here I will mostly be talking about the infrastructure requirements to encourage health mobility in these groups.
Infrastructure Requirements for Children
- Children are highly dependent on two variables to encourage healthy mobility: distance between destinations and safety (traffic/crime as well as perceived/actual).
- Mixed land use and higher population density can primarily lower the distance between destinations. This also increases crime safety by increasing the number of watchful eyes around.
- Traffic calming measures (speed bumps, narrow roads, bendy roads), signage, and sidewalk separation from the road can increase traffic safety.
Infrastructure Requirements for the Elderly
- The elderly are highly focused on safety considerations, and tend to view the personal vehicle as the safest mode of transit. However many elderly do not own cars or cannot drive
- Traffic calming measures, more complete sidewalk networks, and perhaps most importantly lower distance between destinations (mixed land use) increase the safety of elderly pedestrians
- Crossing signals can be timed for elderly walking speed
Note the content of the three tables above comes from the book Health and Community Design by Lawrence D. Frank, Peter O. Engelke, and Thomas L. Schmid, published by Island Press in 2003. Also note that the assumption has been made that parents would be more ok with their children going places themselves if areas are safer. This assumption is made through my own experience (I have transported myself to/from school since early Elementary) and through the book Health and Community Design.
The solution to this ethical concern is to simply focus extra attention during the data collection phase to the infrastructure changes that would disproportionately effect disadvantaged groups. Additionally, during the analysis/modeling phase, more emphasis can be placed upon the data of disadvantaged groups during training. In a highly extreme case, additional sub-models could be created that are dedicated to specifically capturing the travel behavior of these groups.
Additionally, the model outputs should be modified such that the level of service for different disadvantaged groups can be displayed. This way, the model output can show both (1) overall level of service of the transportation network and (2) level of service of the transportation network for specific groups. Of course, level of service for specific groups should be calculated differently than overall level of service