Ethical Development of a Transportation Demand Model
Data Collection and Measurement
The data collection process has two overarching steps. The first step (collection) is to collect raw data, which for the purposes of this project will be location data. The second step (measurement) is to turn that raw location data into meaningful data we can feed into our model. Let's first address raw data.
Raw Data
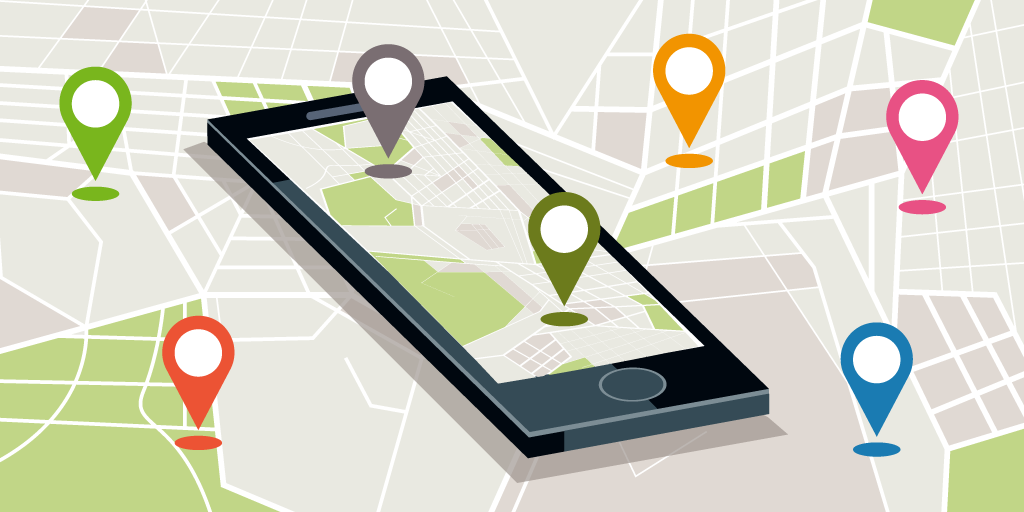
The majority of our data will come from the location data of mobile devices. In the raw form, this will consist of billions/trillions of location pings from various mobile devices in the form of a latitude/longitude coordinate. Specifically, a row of raw location data might look like:
[<device_id>, <latitude>, <longitude>, <timestamp>]
Note that this location data should already capture the behavior of most walk/bike/micro-mobility users as most people do have mobile phones with some kind of location tracking activated. At this point, the ethical concern of privacy may come up, as this kind of location data can be used to track individual people and where they go.
One way to "stalk" people in this manner is if you know their home address. You could look up their <latitude>, <longitude> in the raw data and track them from there. Unfourtunately, at this stage in the data process, there is not much we can do about it if we want to have accurate data. Later on though, data will be aggregated so this will no longer be possible.
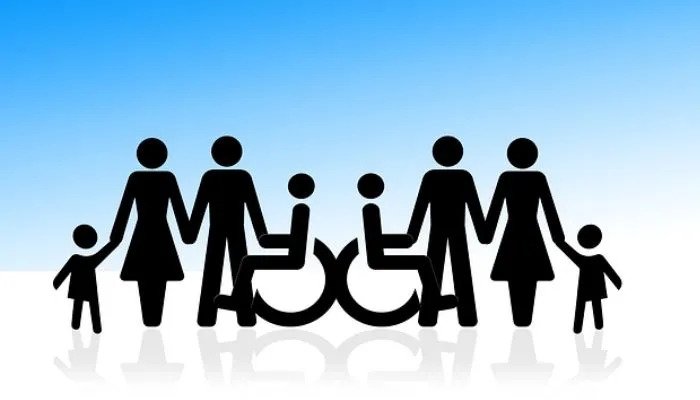
As mentioned on the project home page, since we are focusing on a travel demand model for non-car transportation, we really want to capture the travel behavior of disadvantaged groups, or those that are much less likely (or cannot) drive.
As seen in the picture on the right, these groups include children and the disabled. Some other groups disadvantaged in this way (but not all possible groups) include the elderly and the poor.
Unfortunately, the factors that make these groups disadvantaged (in the lack of car sense) are also factors that result in these groups having lower location-activated mobile devices. The elderly may only be able to use basic phones, or not be able to use phones at all. Young children may not own phones that can track their location due to their parent's policies. The poor may be able to only afford a basic phone.
To really emphasize, the factors that make these groups disadvantaged and the factors that make them less likely to own a location-activated mobile device are very similar or even the same. Additionally, these factors make it so that they are the groups that can most benefit from a travel demand model that can predict the behavior of non-car transportation. In other words, it is critically important to capture their travel behavior.
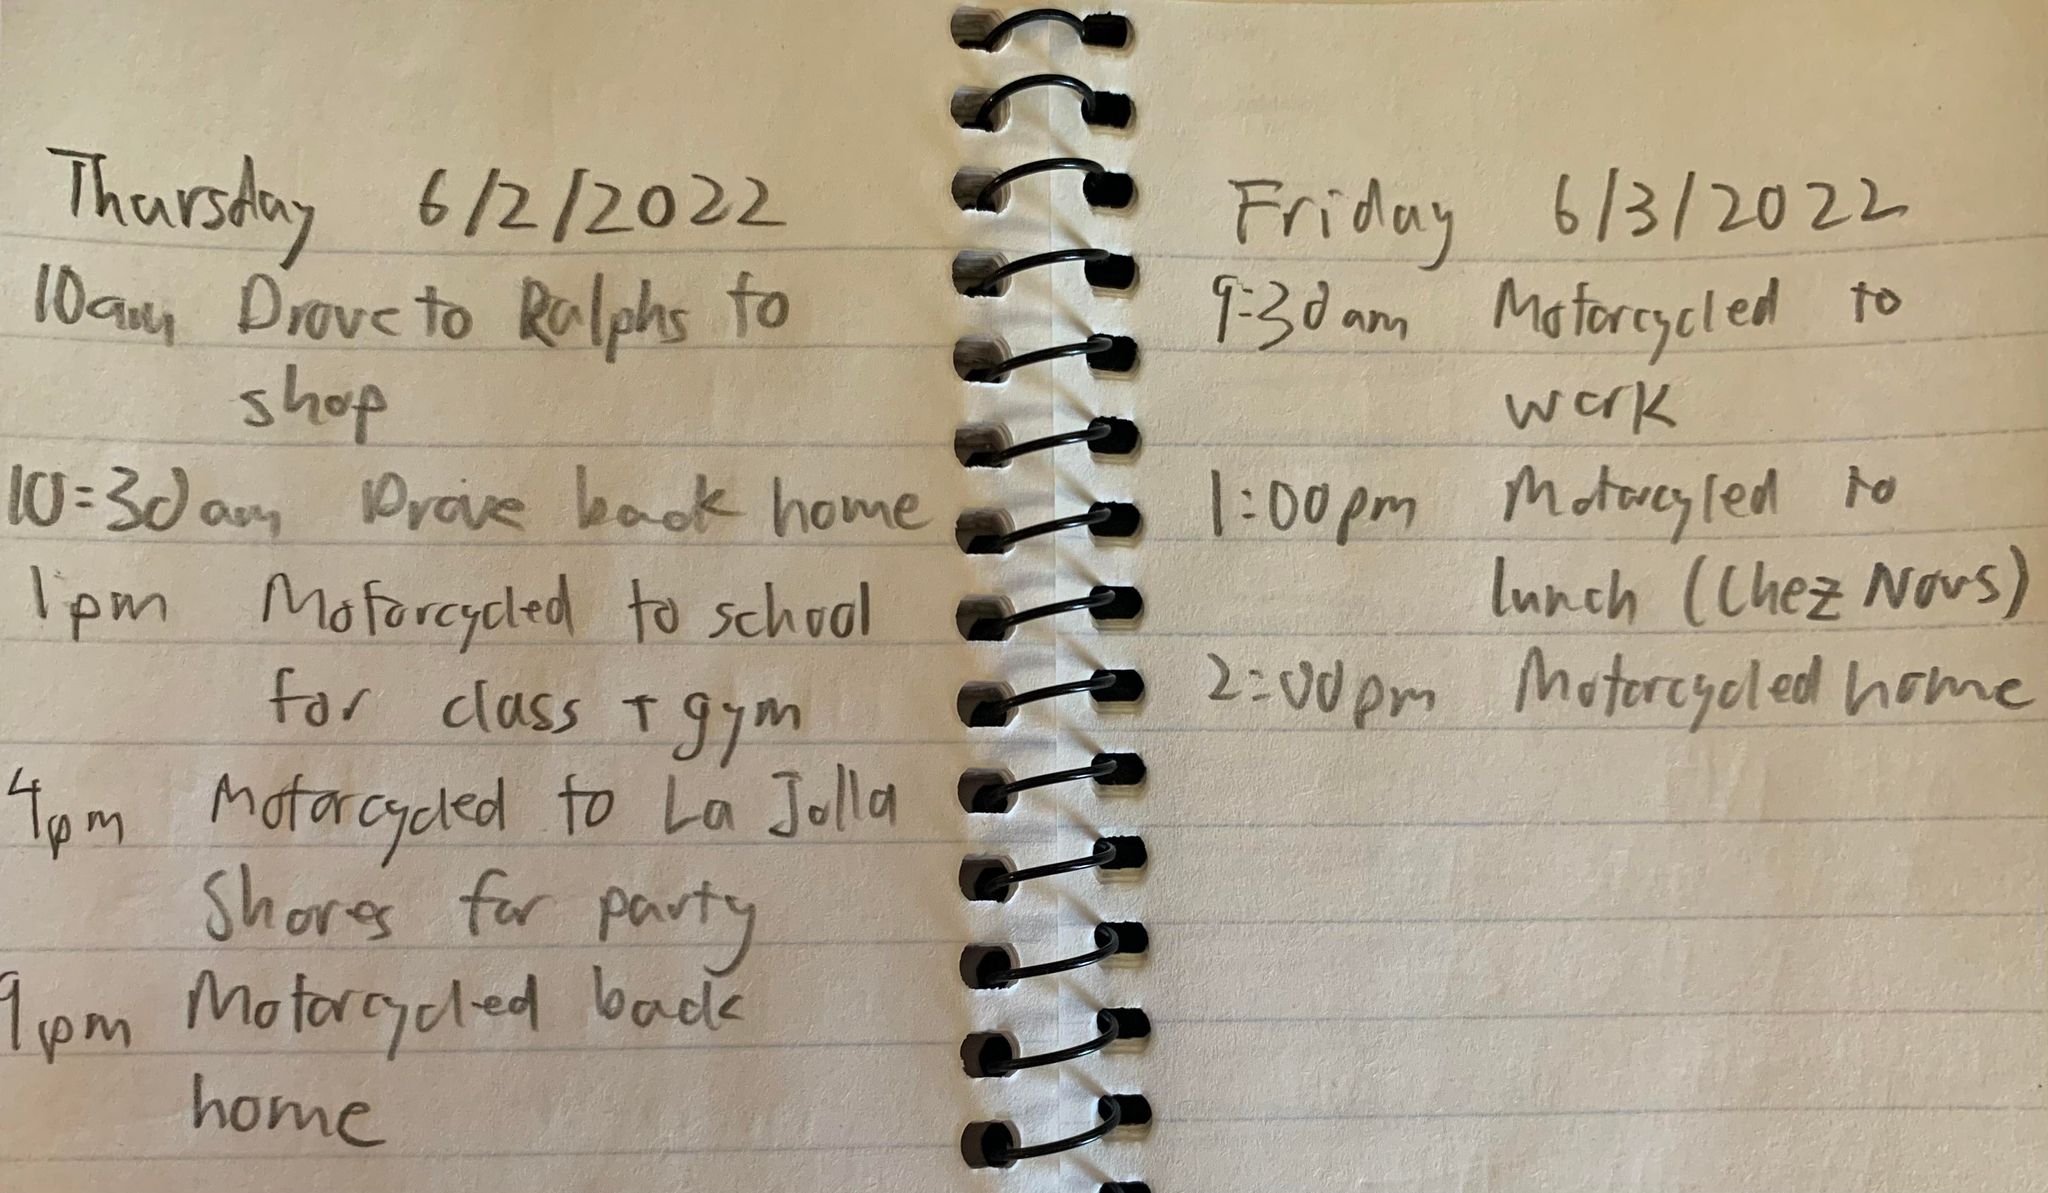
Without mobile device location data, we can really only go to old school methods. Within each of the groups, people will be given some kind of travel journal (see the example in the left image) or survey, with some kind of incentive, monetary or otherwise. It is important to make sure that the samples taken are representative of the various groups as well as representative of general demographics and the geographic area.
To actually find members of these groups, additional legwork will have to be done. For example, to access the trip data of children, it may be sufficient to work within the school system and parents. To access the trip data of the elderly, some of the data could come from volunteers from senior living facilities. To access elderly who cannot afford to live in those facilities, we may have to do mailing/radio/TV campaigns.
After these travel journals/surveys have been filled out for a certain period of time (6 months to a year seems ideal), the data must be manually entered into our database. By nature, this kind of data is much more sparse as there is no chance we get even close to the billions/trillions of location data points. Later on, when we are doing our analysis/modeling, it will be important to really emphasize this data.
As a result of our work, we should have accurately captured the travel behavior of disadvanted groups, ensuring equity in our model.
Data Measurement
The second step of the data process is measurement, which can be further broken into four different steps. Note that since this is primarily a philosophy project, I will not be going too in depth into each of the four steps. Additionally, much of the technical information that follows comes from Dr. Lawrence Frank's USP 180: Transportation Planning slides, a class that I took in Spring 2021 and TA'd in Winter 2022.
The four parts of the data collection process are as follows:
- Split Into Zones: This is step zero because it doesn't take any real work to do. Basically whatever geographic area you are studying should be split up into zones of some kind. Given the purpose and scope of this project, the contiguous United States will be broken up into Census Block Groups. Note, we use Block Groups instead of Blocks because oftentimes Blocks are too small to contain any households or trip destinations. Each Block Group contains on average 39 Blocks, meaning they are much more likely to be meaningful. Additionally, the Block Group is the smallest geographic unit for which the US Census publishes sample data.
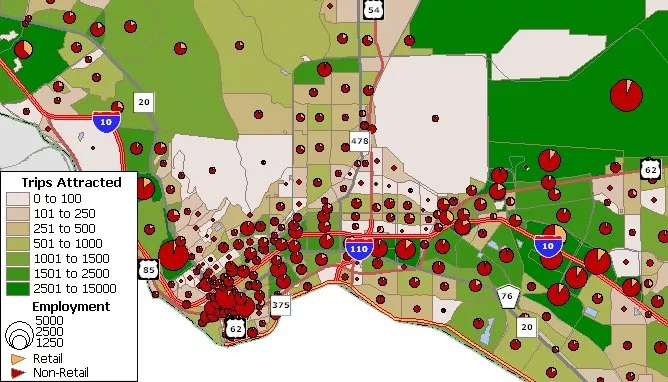
- Trip Generation: This step can be summarized as: "Why would someone go somewhere?" For each Census Block Group (henceforth known as CBG), destinations (work, shop, play, etc.) will be aggregated.
- Trip Distribution: This step can be summarized as "Where are people going and why?" For each CBG, trip origins will be determined and matched to destinations based on location data. Historically, other models have been used such as the gravity model (people go to the closest location (in terms of trip time not distance) that gives them what they want) but in today's age of big data, more accurate methods can be used.
- Mode Choice: This step can be summarized as "How do people get places?" For each trip, travel mode choice (car, carpool, walk, bike, transit, etc.) will be determined based on traffic network distances (car travel time, bike travel time, etc.), various demographic factors (car ownership, bike ownership, etc.), and built/natural environment factors (bike lanes, sidewalk width, connectivity of street network, etc.). This is in no way a comprehensive list, but it gets at the general idea.
- Traffic Assignment: This step can be summarized as "What mode will people choose?" Again for each trip, people will choose a mode of travel based upon factors such as time taken, weather, time, desire for exercise, etc.
Although these four steps are listed in order from one to four, in actuality they are highly interlinked (each of the four steps effect the other three steps).
Skipping over the insane amount of processing such a measurement will take, the resulting database could conceivably look like:
Table 1: Trips
[<trip_id>, <initial location_id>, <final location_id>, <number_of_stops>]
Table 2: Trips in Detail
[<trip_id>, <trip_segmenent_number>, <start location_id>, <end location_id>, <transportation_mode (car, carpool, walk, etc.)>]
Table 3: Locations
[<location_id>, <CBG_id>, <type_of_location (home, work, etc.)>]
If you recall the privacy concerns from earlier, you can see that the final database is aggregated in the sense that no specific locations are given, only the CBG of any location. No longer can you look up the latitude/longitude of someone's house to track their location. Perhaps if someone has a really unique commute, it would still be possible to pick them out from this aggregated database, but that is simply the natural result of our world of almost ubiquitous tracking.
Additional Data
Additional data is also required for the analysis/modeling phase of this project. To keep it short and simple, the additional data required are along the lines of socioeconomic variables, demographic variables, and built/natural environment variables. These variables should all be aggregated to the CBG level.
No further time will be spent on this additional data, as it is already available publicly. For example, see the US EPA Enviroatlas or the US EPA Smart Location Database