Ethical Development of a Transportation Demand Model
Usage/Revision, Scaling, and Long Term Considerations
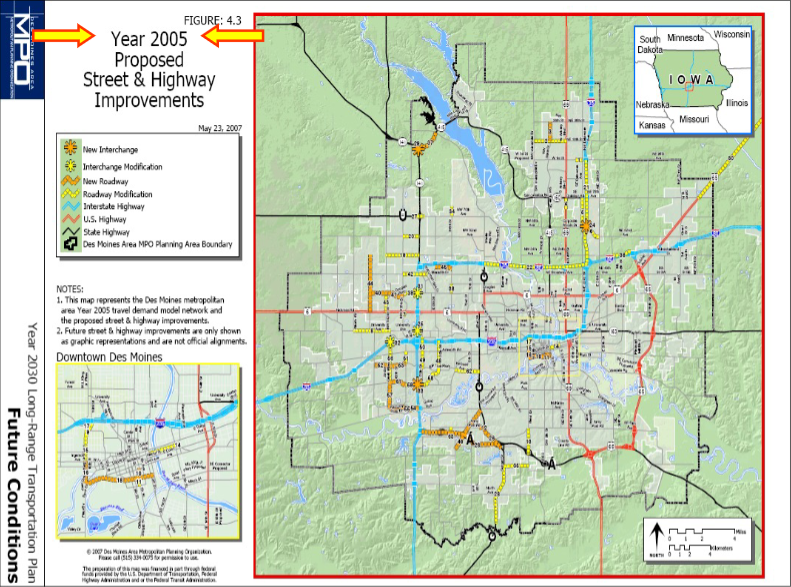
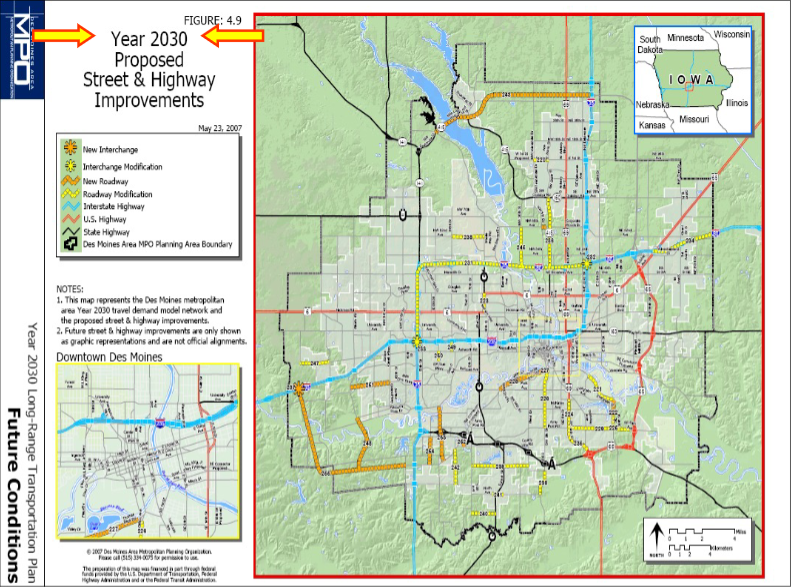
As already mentioned in the Analysis and Modeling section, the output of the model will be a series of maps of the transportation network with level of service values for each segment of the network. The reason multiple maps are output is to see the level of service for different transportation modes, different groups of interest, and different level of service metrics.
Then, using my model, it would be possible to generate a series of maps similar to what can be seen below:
Usage Examples
In addition to analyzing how proposed transportation infrastructure changes will perform over time, my model can also be used to analyze the impact of different proposed infrastructure changes.
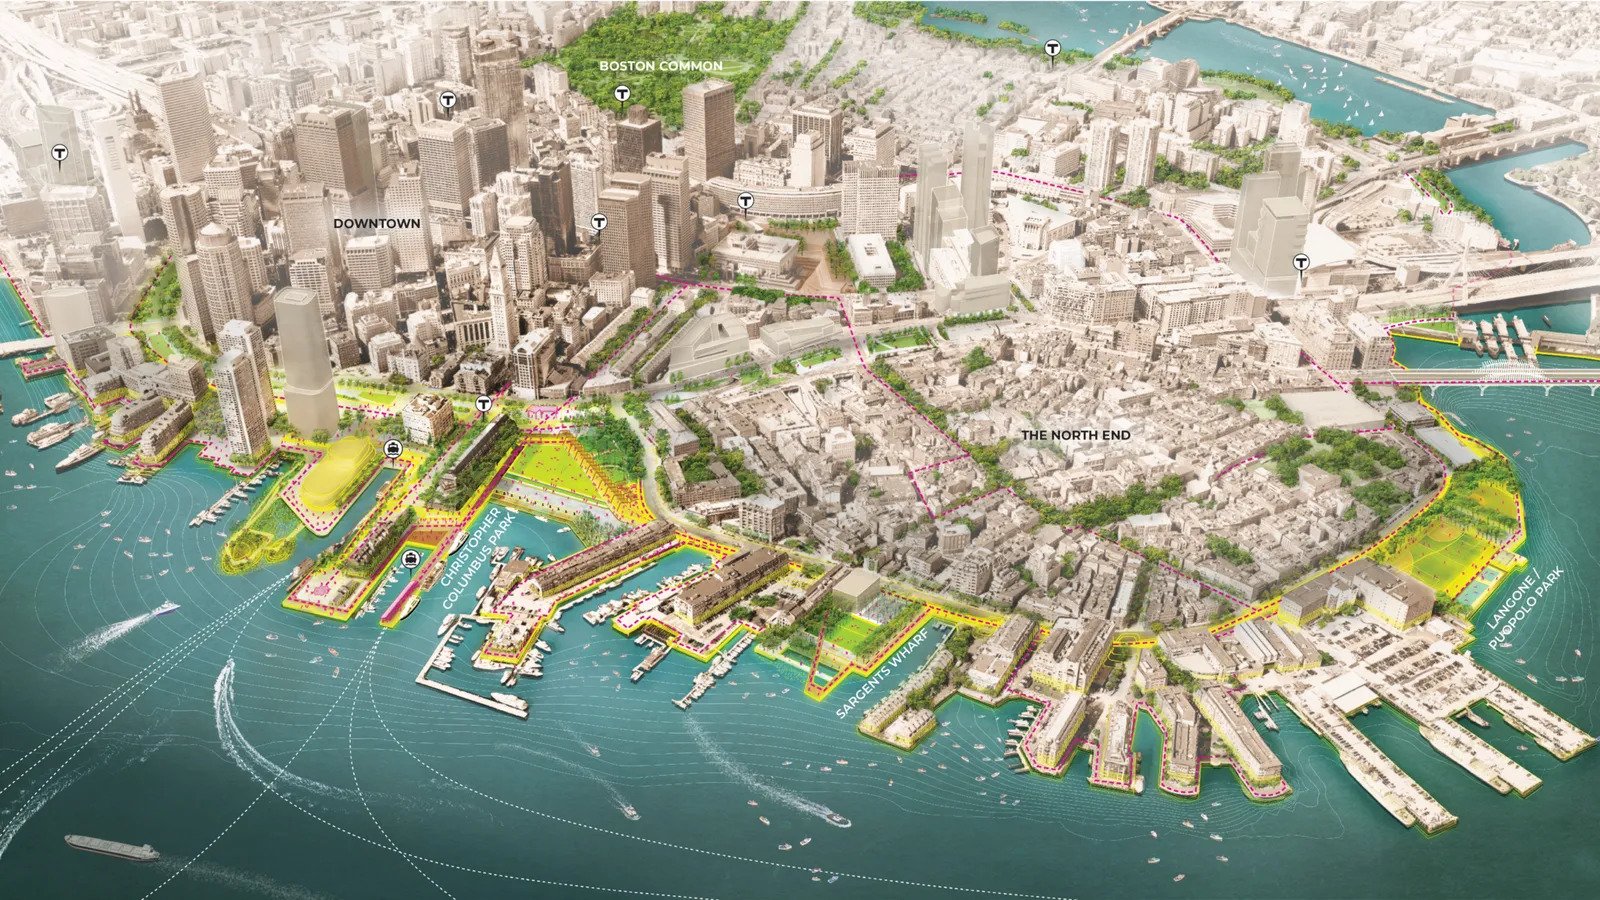
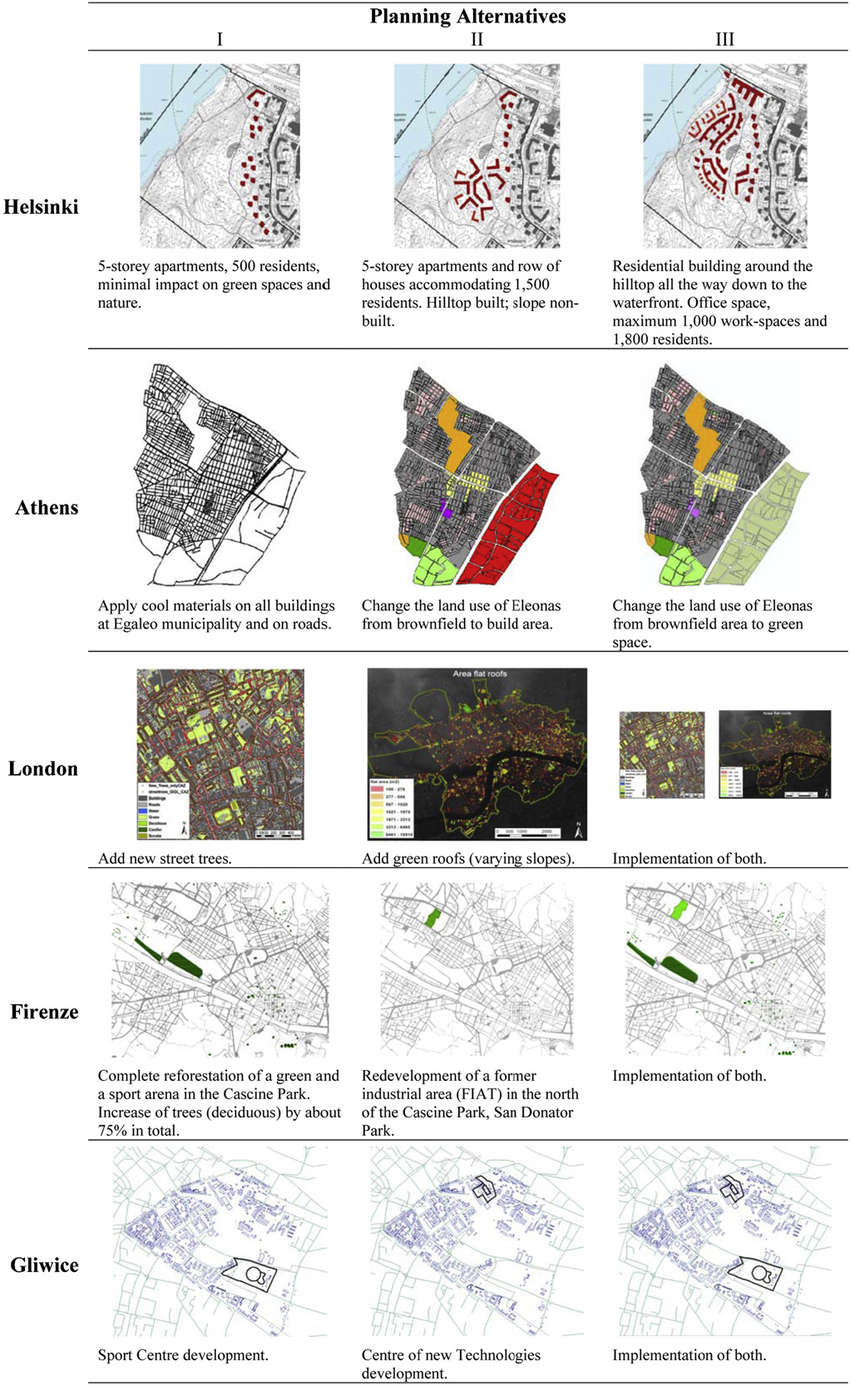
As can be seen in the image on the right, a large variety of infrastructure/housing changes have been proposed for a variety of cities around the world. Using my model, each of these proposals could be analyzed specifically for their impact on non-car transportation and especially the impact on disadvantaged groups.
Let's take the example of the third planning alternative for London, where new street trees would be added and green roofs would be added. An immediate impact of the addition of vegetation would be to reduce the heat island effect (see The US EPA's info page).
By reducing the overall temperature in urban London, the area becomes more attractive (due to increased comfort) for non-car transportation. Additionally, it is more enjoyable to (for example) walk around in an area with trees. These factors would be represented in my model as an overall increased level of non-car transportation for both recreation and utilitarian purposes.
With respect to a specific disadvantaged group, the elderly, such a change in London would have the additional effect of making sidewalks safer (both perceived and actual safety). This is because street trees represent a physical separation between the road and sidewalks (assuming of course that trees are between the road and sidewalk) reducing the perceived/actual risk of cars running onto pedestrian areas. In this sense, my model could accurately predict the increased mobility of the elderly and even encourage urban planners to make these kinds of changes. By raising the level of mobility of the elderly closer to their younger counterparts, better equality has been achieved.
Along similar lines, the proper usage of my model could result in better equality for the mobility of children. The model would show that certain traffic calming measures and mixed land use policies encourage the non-car mobility of children.
If children are allowed to walk/bike/transit to other places (school, friend's houses, parks, etc.) as a result of my model's encouragement, they get daily exercise (helping to combat the childhood obesity epidemic in the US) and gain independence.
To summarize, the proper usage of my model can encourage everyone (but especially members of disadvantaged groups) to be more mobile and healthier.
Revision Examples
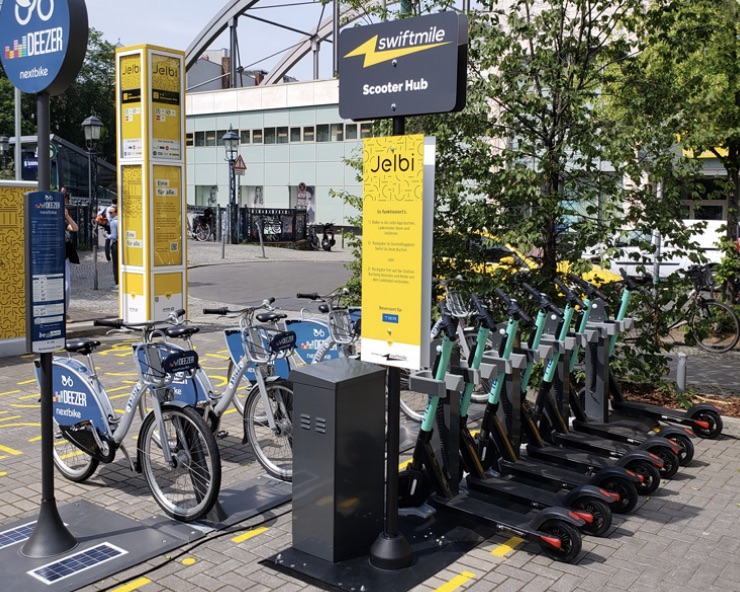
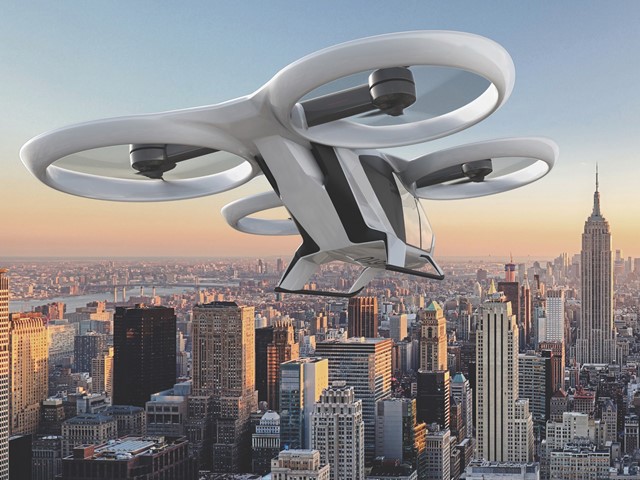
The primary revision situation would occur with the introduction of new transportation technology. In other words, anything from the introduction of micro-mobility sharing platforms to cheap and ubiquitous hovercraft technology would qualify for a revision.
However, not all transportation technologies are built equally. Micro-mobility sharing (or just micro-mobility in general) can easily use existing transportation networks. Perhaps the only bit of revision the model would need would be to consider the effect of those micro-mobility parking spots.
In this situation, the model or one sub-model should be retrained to accommodate this new phenomenon. Data should come from areas that already have implemented such infrastructure improvements and should take the form of before/after trip data. So while data is being gathered or the model is being retrained, the model should not be applied to analyze these kinds of infrastructure improvements.
In the long term, it would be important for the model's maintainers to keep track of new transportation technology so that the model can be updated before the new transportation technology becomes widespread.
However, if hovercrafts were to be introduced, they would likely require significant new infrastructure everywhere for storage, takeoff/landing, and re-fueling. Under such a situation, my model would fail completely to predict how travel mode choice would change.
Similar to the introduction of shared micro-mobility, all that can be done is to (in this case) train a whole new sub-model dedicated to the transportation network of airborne vehicles. I don't expect the adoption of new technology like this to come quick nor be widespread, so there would be time to create a new sub-model.
To be explicit, the data for a new sub-model would come from (most likely geographically limited) pilot programs, peer-reviewed studies, and so on. I would also expect new transportation technology to have rapidly evolving infrastructure requirements, so that would also have to be tracked.
Again, in the long term, some kind of monitoring would be necessary so that new technologies and infrastructure could be added to the model. I expect the technical/financial side of maintaining this model to be the most significant long term consideration.
